-
Color Physics @Hampshire, Day 10
After reviewing the concepts of wavelength, amplitude, and frequency in general, we discussed the special case of electromagnetic waves and the electromagnetic spectrum. The key ideas covered were the
- Inverse relation between the wavelength and frequency of an electromagnetic wave.
- Intensity of a wave and its relation to the amplitude of the wave.
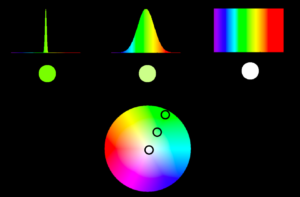
In a lecture-heavy portion of the class, we went over how different properties of an EM wave in the visible spectrum correlate with the hue, saturation, and brightness of the perceived light. I used very good slides developed by Geoff Boynton at the University of Washington.

Geoff Boynton’s slide on the relation of the width of the spectral intensity-distribution of light and the perceived saturation. We introduced the spectral intensity-distribution graphs for light sources and the distinction between spectral colors and non-spectral colors, but also reviewed additive color mixing in the context of the intensity-distribution graphs. We touched on the relevance of additive mixing to the pointillist painting movement developed by Seurat.
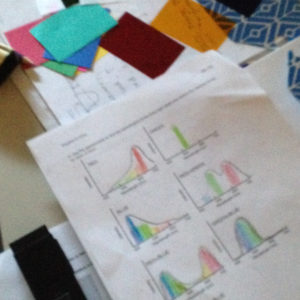
Students then used hand-held spectrometers to determine the intensity-distribution for the red, green, and blue LED’s we used in additive mixing exercises earlier in the semester. We also tried to determine the spectrum of the mixture various pairs of lights. This was tricky because of the light pollution in the room and the fact that the light from two LED’s was coming from different angles and scattering within the spectrometer.
 Students measured and recorded the intensity distributions of light from LEDs.
Some of the students got to start playing with color filters and explore their absorption spectrum, but more formal introduction was left for the following class.